Demography Explained: How Minor Trends Lead to Major Changes
April 18, 2026The Power of Small Numbers: How Minor Trends Lead to Major Futures
In demography, small changes in the present act like compound interest in a bank account—minor percentage shifts today can lead to staggering differences over a century. This phenomenon is driven by the compounding effect of fertility rates and the long-term impact of population momentum.
The 0.5 TFR Divergence
A minor difference in the Total Fertility Rate (TFR)—the average number of children a woman has—can completely reshape the global map over 100 years. According to United Nations scenarios, the difference between a “Low Fertility” scenario (where every other woman has 0.5 fewer children) and a “High Fertility” scenario is the difference between a world of 7 billion people and 14.4 billion people by the year 2100. This 7.4-billion-person gap is created by a mere 1.0 child-per-woman difference in reproductive behavior, compounded over multiple generations.
The “Birth Crossover” and Minority Pluralities
Minor shifts in the proportion of births can lead to total demographic turnovers at the sub-national level. A prime example is Kerala. Although all religious groups in the state have fertility rates below the replacement level, small differences in their current “birth shares” are driving rapid change :
- The Current Gap: As of 2019, Muslims in Kerala accounted for 44.4% of all live births, despite being only 26.6% of the total population in the 2011 census.
- The Cause: This is not due to “high” fertility (the Muslim TFR in Kerala is roughly 1.7–1.8, which is actually below replacement), but rather a “birth crossover” where Hindu fertility has crashed even further to approximately 1.0–1.1.
- The Long-term Result: This annual “minor” lead in births is projected to result in Hindus losing their absolute majority (falling below 50%) in Kerala by roughly 2050, turning the state into a collection of three large minorities with no single dominant group.
Regional Hotspots and “Parity” Timelines
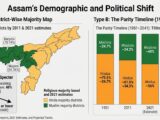
Similarly, in Assam, a consistent growth rate differential is leading to an imminent shift. The state’s Muslim population share rose from 24.7% in 1951 to 34.2% in 2011. Projections suggest that if current regional growth trends—influenced by both natural increase and historical migration—continue, the Hindu and Muslim populations in the state will reach 50/50 parity by 2041. In West Bengal, a similar but slower process is underway; while it currently has a 27% Muslim share (officiallu), a compound growth formula suggests the two populations will reach equality in approximately 130 years (around 2150).
Gender Imbalance and Son Preference
Another “minor” data point with major long-term consequences is the Child Sex Ratio. In communities where there is a strong preference for sons, the number of girls (future mothers) is reduced. In India, the 2011 census showed a ratio of 913 girls per 1,000 boys for Hindus compared to 943 for Muslims. Over 100 years, having a larger “maternal cohort” (more women surviving to reproduce) gives the Muslim community higher population momentum, even as their individual fertility rates decline toward parity with the majority.
These examples demonstrate that demographic change is not an overnight explosion, but a gradual compounding of small annual variations. Like a ship changing its course by just one degree, the deviation is barely noticeable at first, but it determines an entirely different destination a century later.
We welcome your comments at letters@friedeye.com